Title here
Summary here
Adaptyst is an open-source and architecture-agnostic modular performance analysis tool, where modules can integrate existing work (such as profilers) and be made by external developers. The goal of the program is addressing users’ software, hardware, and system needs in a future-proof way by suggesting the most optimal compute solution for a given workflow and requirements while considering all sides of computation.
At the moment, Adaptyst concentrates on profiling and already supports all CPUs running Linux thanks to our linuxperf module which samples in detail both on-CPU and off-CPU activity of every spawned thread and process of a program, profiles low-level interactions with hardware, and more: see the linked documentation page. There’s also preliminary support of NVIDIA GPUs provided by our nvgpu module. More modules from the Adaptyst team are already planned / work in progress.
External modules
Modules created by external developers can provide more features than the ones described in this documentation: check respective documentation pages of the modules (outside of the Adaptyst website) for more information.
Later, through PhD research at ETH Zürich and CERN along with other potential collaborations, Adaptyst will move towards realising the goal outlined in the first paragraph, i.e. becoming a unified full-stack performance analysis and automated computer system design tool working across the entire spectrum: from embedded/edge computing to high-performance and distributed computing. This will happen while maintaining the modular design of the tool.
After going through the documentation, you are welcome to follow our blog and consult the Adaptyst management system (becoming live soon) to see the progress achieved so far towards that vision (please note that the management system is not meant to show the entire envisaged roadmap at once, so seeing few or none of roadmap-related issues at a given moment does not mean that no progress is being made).
Adaptyst intermediate representation change
Last update: 25 March 2026
We are changing the intermediate representation used by Adaptyst from SDFGs to MLIR. See the announcement here.
The first stage of this switch is already live: DaCe is no longer a dependency of Adaptyst and the internals of the tool have been rewritten to accommodate the future MLIR integration while providing higher API stability for module developers.
The single-command-analysis mode mentioned later in the documentation currently uses neither SDFGs nor MLIR: later, there will be also the MLIR version of it. Both variants will stand on an equal footing and be maintained.
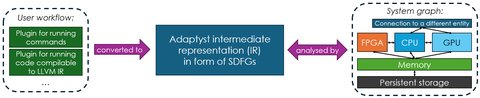
The usage of Adaptyst starts with defining a workflow to be analysed, using one or more plugins that can be made either externally or by the Adaptyst team. This can capture a variety of scenarios from across computing, but the most common one is running a specific software code. The plugins are responsible for translating the use case(s) they represent into the Adaptyst intermediate representation in form of stateful dataflow multigraphs (SDFGs; they are part of the DaCe framework and explained here).
Current user workflow support
Adaptyst supports running single commands only at the moment. This is the simplest possible scenario and the way it should be used is explained in Running Adaptyst.
When an update expanding the user workflow support is released, a new documentation page will be added describing in detail the expressiveness of user workflows in Adaptyst and how to define them.
When the user workflow is compiled into an SDFG, it is processed by a set of system/hardware modules forming a system graph representing a computer system with nodes (like peripherals) grouped into entities (like servers): each module can be made either externally or by the Adaptyst team and it is responsible for performance analysis with respect to a specific system component (e.g. a CPU or its part, a GPU or its part, an FPGA, networking).
In the future, as the R&D work on Adaptyst progresses, the modules will take part in determining the best compute solution for the SDFG while considering all sides of computation and user requirements. This will include software optimisations, hardware choices/customisations (e.g. deciding whether a GPU is needed and what parts of the workflow should go to a GPU if so), and system adjustments. At the same time, flexibility will be maintained throughout the entire process: a user will be free to decide whether Adaptyst should concentrate more on the software, system, or hardware side when determining the compute solution. See System graphs for more details about system graphs in Adaptyst and what role they will play in automatic computer system design.
Plugin vs module
In the context of Adaptyst and throughout this documentation, a plugin refers to user workflows (the part of the flow diagram to the left of SDFGs) while a module refers to a system graph (the part of the flow diagram to the right of SDFGs).
After performance analysis is finished, the results can be inspected in a variety of ways, including by our dedicated tool Adaptyst Analyser producing an interactive website. The official API for advanced result analysis is planned.
The table below compares Adaptyst to some of the more popular maintained profilers. It is important to note though that the tool is not meant to compete in the profiling market: it is meant to integrate existing work to provide unified full-stack performance analysis allowing both a macroscopic and microscopic view on computing performance. Additionally, Adaptyst aims to expand on that work to provide automatic optimisation suggestions while considering all sides of computation.
If there are any inaccuracies, please let us know.
| Target | Analyses SW-HW interaction1 | Open-source | Off-CPU profiling | Support of computer architectures/systems beyond CPUs | |
|---|---|---|---|---|---|
| Adaptyst | Computing on Linux now, later: all computing | Yes | Yes | Yes | Yes, flexible via external modules |
| Original “perf” | Computing on Linux | Yes | Yes | Limited | No |
| Intel VTune Profiler | Computing on Intel HW | Yes | No | Yes | Yes, Intel only |
| AMD μProf | Computing on AMD HW | Yes | No | Yes | Yes, AMD GPUs only |
| valgrind | Computing on CPUs | No | Yes | No | No |
| gprof | Computing on CPUs | No | Yes | No | No |
| gperftools | Mostly computing on Linux | No | Yes | No | No |
| NVIDIA profilers | Computing on NVIDIA HW | Yes | No | Yes | Yes, NVIDIA GPUs only |
| TAU | Mostly HPC | Yes | Yes | Yes | Yes, GPUs and Kokkos only |
| HPCToolkit | Mostly HPC | Yes | Yes | Yes | Yes, GPUs only |
1 If supported by a user’s hardware architecture.
In the context of the R&D work towards realising the vision outlined in the introduction, you can have a look at the review of the existing related work here.