Title here
Summary here
linuxperf is an Adaptyst system module built on top of Linux “perf” with custom patches:
-fno-omit-frame-pointer and -mno-omit-leaf-frame-pointer
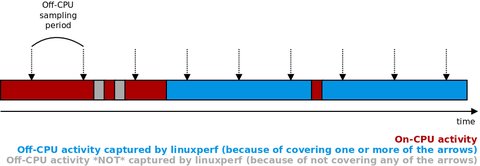
if available) by detecting inappropriate kernel and CPU configurations automatically.On-CPU profiling uses perf with the task-clock event. Off-CPU profiling is based on
eBPF-implemented sampling explained with the diagram below (using the example of a single
process with interleaving on-CPU and off-CPU activity). The sampling period is calculated from a
user-provided off-CPU sampling frequency.
The module is open-source and licensed under GNU GPL v2 (this GPL version only). The repository can be found on GitHub.
To use linuxperf, you need to satisfy the Adaptyst core requirements and the requirements below:
CONFIG_DEBUG_INFO_BTF=y (or equivalent, you can check this by seeing if /sys/kernel/btf exists in your system)CONFIG_FTRACE_SYSCALLS=y (or equivalent, you can check this by seeing if /sys/kernel/tracing/events/syscalls exists in your system and is not empty, but you may need to mount /sys/kernel/tracing first)CONFIG_KALLSYMS=y and CONFIG_KALLSYMS_ALL=y (or equivalent) should also be set./sys/kernel/btf and /sys/kernel/tracing/events/syscalls as explained above and you don’t care about having kernel debug symbols, you’re already good to go here!If you build from source, you also need:
Using Clang 20+ for building “perf”
The bug causing eBPF-based off-CPU profiling to fail in the patched “perf” compiled with Clang 20+ has been fixed, so the requirement of using Clang older than 20 has been lifted.
Development headers
If you build from source, development headers of the dependencies above should also be installed! Otherwise, the compilation may fail.
(The headers of addr2line, CMake, Clang, flex, and Bison are not needed.)
The tested dependency versions are a guideline only, linuxperf may compile and run without issues with older versions. However, it is recommended to use the newest versions available for your distribution (or for installing from source if distribution versions don’t solve e.g. compilation errors).
linuxperf uses the patched “perf”, temporarily available at
https://gitlab.cern.ch/adaptyst/linux (inside tools/perf). However, you don’t have to download and install it manually, this is handled automatically by the installation scripts (see the “Manually from source” section below). If there are extra dependencies actually needed by the patched “perf” and not listed above, please
let us know.
A profiled program along with dependencies should be compiled with frame pointers (i.e. in case of gcc, with the -fno-omit-frame-pointer flag along with -mno-omit-leaf-frame-pointer if available). If you can, it is recommended to have everything in the system compiled with frame pointers (this can be achieved e.g. in Gentoo and Fedora 38+).
Short version:
git clone -b v0.1.0-dev.2026.03a https://github.com/Adaptyst/adaptyst-linuxperf
cd adaptyst-linuxperf && mkdir build && cd build
cmake ..
cmake --build .
sudo cmake --install .
Long version:
Please clone
the GitHub repository at the tag of your choice (it’s usually the newest one from
here) and run cmake <path to your repository> in a separate directory (as either non-root or root, non-root recommended) followed by cmake --build . (as either non-root or root, non-root recommended) and cmake --install . (as root unless you run the installation for a non-system module directory). The patched “perf” is downloaded and set up automatically by the build system (in a way not conflicting with any existing “perf” installations by default).
Here are the CMake options you can use/change for linuxperf:
ROOFLINE: indicates whether cache-aware roofline support should be enabled (default: ON, this requires GCC)INSTALL_PATH: indicates the path where linuxperf should be installed (default: the value provided by Adaptyst via ADAPTYST_MODULE_PATH in CMake, this is usually <user install prefix>/opt/adaptyst/modules)PERF: indicates whether the patched “perf” should be compiled and installed (default: ON). If this option is set to OFF, no other PERF_* values will be considered and the path to a local “perf” installation needs to be set manually via the perf_*
module options.PERF_REPOSITORY_DIR: indicates the path to a local (not remote) patched “perf” repository which should be used for setting up “perf” (as a reminder, the patched “perf” is available at
https://gitlab.cern.ch/adaptyst/linux). If this is set, “perf” will not be downloaded.PERF_TAG: indicates the git tag in the Adaptyst patched “perf” repository to be cloned/downloaded when setting up “perf” (default: dev-20250408)Short version:
git clone -b v0.1.0-dev.2026.02a https://github.com/Adaptyst/adaptyst-analyser-linuxperf
adaptyst-analyser adaptyst-analyser-linuxperf
Long version:
The module for Adaptyst Analyser can be found on
GitHub. As for all modules, the Adaptyst Analyser part is independent of the Adaptyst one and can be installed via adaptyst-analyser by cloning the repository at the tag of your choice (it’s usually the newest one from
here) and running adaptyst-analyser <path to the cloned repository>.
Before running the module for the first time, you need to set the maximum number of stack entries to be collected by running sysctl kernel.perf_event_max_stack=<value>, where <value> is a number of your choice larger than or equal to 1024. Otherwise, the off-CPU profiling will fail.
Important
Max stack sizes larger than 1024 are currently not supported for off-CPU stacks! The maximum number of entries in off-CPU stacks is always set to 1024, regardless of the value of kernel.perf_event_max_stack.
If your machine has NUMA (non-uniform memory access), you should note that NUMA memory balancing in Linux limits the reliability of obtaining complete stacks across all CPUs / CPU cores. In this case, you must either disable NUMA balancing by running sysctl kernel.numa_balancing=0 or run Adaptyst with linuxperf on a single NUMA memory node.
By default, linuxperf must have root permissions to be used.
However, linuxperf can be also used as non-root as long as all of the requirements below are met:
setcap cap_perfmon,cap_bpf,cap_ipc_lock+ep <path to "perf">, the default path is /opt/adaptyst/modules/linuxperf/perf/bin/perf). If you want to see kernel symbols in stack traces, the executable must also have the CAP_SYSLOG capability set as permissive and effective.tracing group. If it doesn’t exist, you must create it first. The tracing name is arbitrary here, you can give the group any name you want./sys/kernel/tracing is mounted as tracefs with permissions 750 or more lax and as the tracing group./sys/kernel/tracing in a standard way if not mounted yet (i.e. run mount -t tracefs nodev /sys/kernel/tracing)./sys/kernel/tracing is mounted in a standard way, remount the directory by running mount -o remount,mode=0750,gid=<GID of the tracing group> /sys/kernel/tracing./sys/kernel/tracing by running for example chown -R root:tracing /sys/kernel/tracing. You may also need to change file permissions in a similar way by running for example chmod -R 750 /sys/kernel/tracing.If Adaptyst is run in a Docker container, please note the following:
--pid=host helps./sys/kernel/tracing manually, either when creating your container or inside your container./sys/kernel/tracing.If Adaptyst is run in an Apptainer/Singularity container, please note the following:
apptainer-suid must be installed in addition to Apptainer alone)./sys/kernel/tracing must be mounted in the container, e.g. by bind mounting in Apptainer/Singularity.| Name | Type | Default value | Explanation |
|---|---|---|---|
| buffer_size | Unsigned integer | 1024 | Internal communication buffer size in bytes. |
| warmup | Unsigned integer | 1 | Warmup time in seconds between all profilers signalling their readiness and notifying the analysed program that it can start. Increase this value if you see missing information after profiling. |
| freq | Unsigned integer | 10 | Sampling frequency per second for on-CPU time profiling. |
| buffer | Unsigned integer | 1 | Buffer up to this number of events before sending data for processing (1 effectively disables buffering). |
| off_cpu_freq | Integer | 1000 | Sampling frequency per second for off-CPU time profiling (0 disables off-CPU profiling, -1 makes linuxperf capture all off-CPU events). |
| off_cpu_buffer | Unsigned integer | 0 | Buffer up to this number of off-CPU events before sending data for processing (0 leaves the default eBPF adaptive buffering, 1 effectively disables buffering). |
| events | Array of strings | [] | Extra perf events to be used for sampling with a given period. The strings must be of form EVENT,PERIOD,TITLE,UNIT each, i.e. do a sample on every PERIOD occurrences of EVENT and display the results under the title TITLE with a unit UNIT at a website. Run perf list for the list of possible values for EVENT. |
| filter | One of: deny:<FILE>, allow:<FILE>, python:<FILE>, or an empty string (i.e. not set) | Not set | Set stack trace filtering options. deny:<FILE> cuts all stack elements matching a set of conditions specified in a given text file. allow:<FILE> accepts only stack elements matching a set of conditions specified in a given text file. python:<FILE> sends all stack trace elements to a given Python script for filtering. Unless filter_mark is used, all filtered out elements are deleted completely. See
Stack filtering for more details. |
| filter_mark | Boolean | False | When filter is used, mark filtered out stack elements as “(cut)” and squash any consecutive “(cut)"’s into one rather than deleting them completely. |
| capture_mode | One of: kernel, user, or both | user | Capture only kernel (kernel), only user (i.e. non-kernel, user), or both stack trace types (both). See
Kernel and user stacks for more details. |
| perf_path | String | perf | Path to the patched “perf” installation. Change it only if you know what you’re doing. Relative paths have the loaded library path as the parent. |
| perf_script_path | String | Empty string | Path to the linuxperf scripts interacting with “perf”. Change it only if you know what you’re doing. Relative paths have the loaded library path as the parent. |
| roofline* | Unsigned integer | 0 | Run also cache-aware roofline profiling with the specified sampling frequency per second (0 means “do not run roofline profiling”). See Cache-aware roofline analysis for more details. |
| roofline_benchmark_path* | String | Not set | Path to the cache-aware roofline benchmarking results produced by the CARM Tool. Either this option or carm_tool_path must be set if roofline > 0. |
| carm_tool_path* | String | Not set | Path to the CARM Tool cloned repository. Either this option or roofline_benchmark_path must be set if roofline > 0. |
*These options are not available if linuxperf has been compiled without the cache-aware roofline analysis support.
Code regionisation is currently not supported, but it will become supported soon.
To have a finer control of what parts of stack traces are saved and processed into flame graphs for example, linuxperf offers an option of defining a dedicated filter using either regular expressions or a custom Python script implementing the filtering API.
A regex-based filter can be configured using a text file. The syntax is as follows:
# Each line can be either a comment starting with #, a regex prefixed
# by "SYM " indicating that symbol names should be queried in stack traces,
# a regex prefixed by "EXEC " indicating that executable paths (e.g.
# shared libraries) should be queried in stack traces, a regex prefixed
# by "ANY " indicating that both symbol names and executable paths should
# be queried, or "OR" separating the condition groups.
#
# A condition group is a set of SYM, EXEC, and ANY statements. The group
# is considered satisfied when *all* statements inside it evaluate to true.
#
# The entire filter evaluates to true when *any* condition group evaluates
# to true.
#
# In the example below, the filter for a stack trace element evalues to true
# when *either*:
# - the symbol name in the element matches <regex1> AND the executable path
# in the element matches <regex2> AND anything in the element matches <regex3>
# - the executable path in the element matches <regex4>
# - the executable path in the element matches <regex5>

SYM <regex1>
EXEC <regex2>
ANY <regex3>
OR
EXEC <regex4>
OR
EXEC <regex5>
Regular expressions should be written using the Python variant. The filter defined in this way processes every element in a stack trace one-by-one, so it is not possible to make e.g. conditions based on the contents of several elements at once. This can be done using the Python API instead.
After the filter is defined, it can be supplied to linuxperf via the “filter” option. The filter can serve as either an allowlist (i.e. if the filter evaluates to true for an element, the element is saved, otherwise the element is cut) or a denylist (i.e. if the filter evaluates to true for an element, the element is cut, otherwise the element is saved).
For more advanced use cases, linuxperf allows running a Python script which is given a full stack trace at once per sample/event for processing.
The script should implement the following global methods:
setup() (no arguments and no return value): called once at the beginning
of profiling by each “perf”-based profiler (linuxperf uses two such profilers
by default: one for process/thread tracing and one for on-CPU/off-CPU profiling.
Additionally, one profiler per custom performance counter is also used.)process(callchain) (callchain is a tuple and the return value is
a list): called once per sample/event with an entire stack trace stored in
callchain and returning the list of exactly the same size as
callchain, where the only values are True or False,
indicating at the i-th index whether the i-th element of the stack trace
should be saved (True) or cut (False)callchain is of form ((symbol name, executable
path), offset address). The first element is the top of the stack.symbol name is a string and can be either a demangled
symbol name if found, an executable path enclosed in [] (e.g. [/lib/libc.so])
if found, or in the worst case, an instruction pointer address in hex enclosed in
[] (e.g. [0xFF]).executable path is a string and can be either an executable path if found or
an empty string otherwise.offset address is a string and can be either an offset address in hex within
the executable pointed to by an executable path if found or an instruction pointer
address in hex otherwise.Once your script is defined, it can be supplied to linuxperf via the “filter” option.
Security warning
The Python API allows executing an arbitrary Python code! Please exercise extreme caution when asking linuxperf to use scripts from unknown sources for filtering.
By default, when a stack trace element is meant to be deleted, it is removed completely without leaving any traces (e.g. if B is cut from A -> B -> C, only A -> C remains).
However, it is possible to tell linuxperf to mark deleted elements as (cut)
instead, where all consecutive (cut)’s are squashed into one (cut),
e.g. if B is cut from A -> B -> B -> C -> B -> D, the resulting trace is
A -> (cut) -> C -> (cut) -> D. In order to do so, set the “filter_mark”
option.
By default, linuxperf collects only stack traces from the user space of a program. However,
there is an option of accessing the kernel space as well and obtaining traces from there.
Please use the “capture_mode”
option for this: you can ask linuxperf to extract either user
stacks only (user), kernel stacks only (kernel), or both stack traces
(which are merged into one then) (both).
Unless you profile a specialised program involving e.g. device drivers, you shouldn’t need to change where stack traces will be collected from for a given application.
User space vs kernel space
If you are not familiar with the “user space” and “kernel space” terms, please check out this Wikipedia article.
By default, cache-aware roofline profiling is not performed. If you want to use this feature, this section is for you.
Thanks to the integration with the CARM Tool from INESC-ID, linuxperf can automatically perform cache-aware roofline profiling of your program after doing a few initial configuration steps.
As the result, it will be possible to view various roofline graphs in Adaptyst Analyser and plot specific code segments there to quickly check whether they are more memory-bound or compute-bound.
Supported architectures
Currently, only x86-64 Intel CPUs are supported. Adding support for x86-64 AMD CPUs is work in progress.
To get started, clone the CARM Tool repository from https://github.com/champ-hub/carm-roofline and set the “carm_tool_path" option to the path to the cloned repository directory.
In order to run cache-aware roofline profiling in addition to standard analysis done by linuxperf, set the “roofline” option to the sampling frequency of roofline-related performance counters (in Hz, sampling is done in the same way as custom “perf” events).
If no roofline benchmarking has been performed for a machine yet, linuxperf will start the CARM Tool automatically and let it perform the necessary tests. This may take a long while, so you have to be patient here. Afterwards, your session will be run as usual.
It is also possible to run the roofline benchmarks manually. In this case, please run the run.py script inside the CARM Tool repository and set the “roofline_benchmark_path”
option to the path to the CSV file generated by the CARM Tool.
Normally, the CSV file is produced inside carm_results/roofline in the directory where run.py has been run. The location may be different if you have used custom options in run.py, please consult the CARM Tool documentation and/or help message then.
Note
If you run roofline benchmarks manually, you don’t have to specify the “carm_tool_path” option as long as the “roofline_benchmark_path” one is set.
Note
A more interactive/pictorial version of this section is coming soon!
In the meantime, you can see the video demo here.
The Adaptyst Analyser part of the module can be set up by following the instructions here.
As suggested by the introduction, the main view of results produced by linuxperf in Adaptyst Analyser is a timeline of threads/processes:
If you have a session with a huge number of off-CPU regions, rendering the timeline may become resource- and time-consuming for a web browser. In this case, you may want to enable off-CPU timeline sampling which samples captured off-CPU regions in a similar way linuxperf samples off-CPU activity during profiling.
This can be done on the client side by setting the off-CPU timeline display scale to less than 1 in the module settings (the smaller the value is than 1, the larger the sampling period is; the current period is shown when a session is opened).
If you get an error message similar to the one in the title, please look at the logs saved by Adaptyst.
If the logs mention “can’t access trace events”, permission denied issues, or problems with eBPF, please ensure that the requirements for using linuxperf as non-root are met or run Adaptyst as root. If it doesn’t work or the logs specify a different problem (or don’t say anything), feel free to contact us.
If you get a warning message as in the title, you can check whether your profiled program can be configured to emit “perf” symbol maps as documented here.
You should note that the lack of symbol maps is not an error, it will just make some symbol names unresolved and point to the name of an expected map file instead. This does not cause broken stack traces.
The patched “perf” is an integral part of linuxperf. When you get errors at the stage of setting up “perf” and they point to some dependency missing (e.g. Clang), please install it and try again. If you get complaints about a program/library missing which is not listed in the installation instructions, please install it as well and let us know!
If the solution above doesn’t help, you can
contact us. Additionally, if you know what you’re doing, you can change the “perf” compilation and installation settings (e.g. disable it altogether) in CMake (see
here) and for example, try setting up the patched “perf” manually (the repository is at
https://gitlab.cern.ch/adaptyst/linux, go inside tools/perf there).